Data Displays – Year 4
Click here to preview this resource
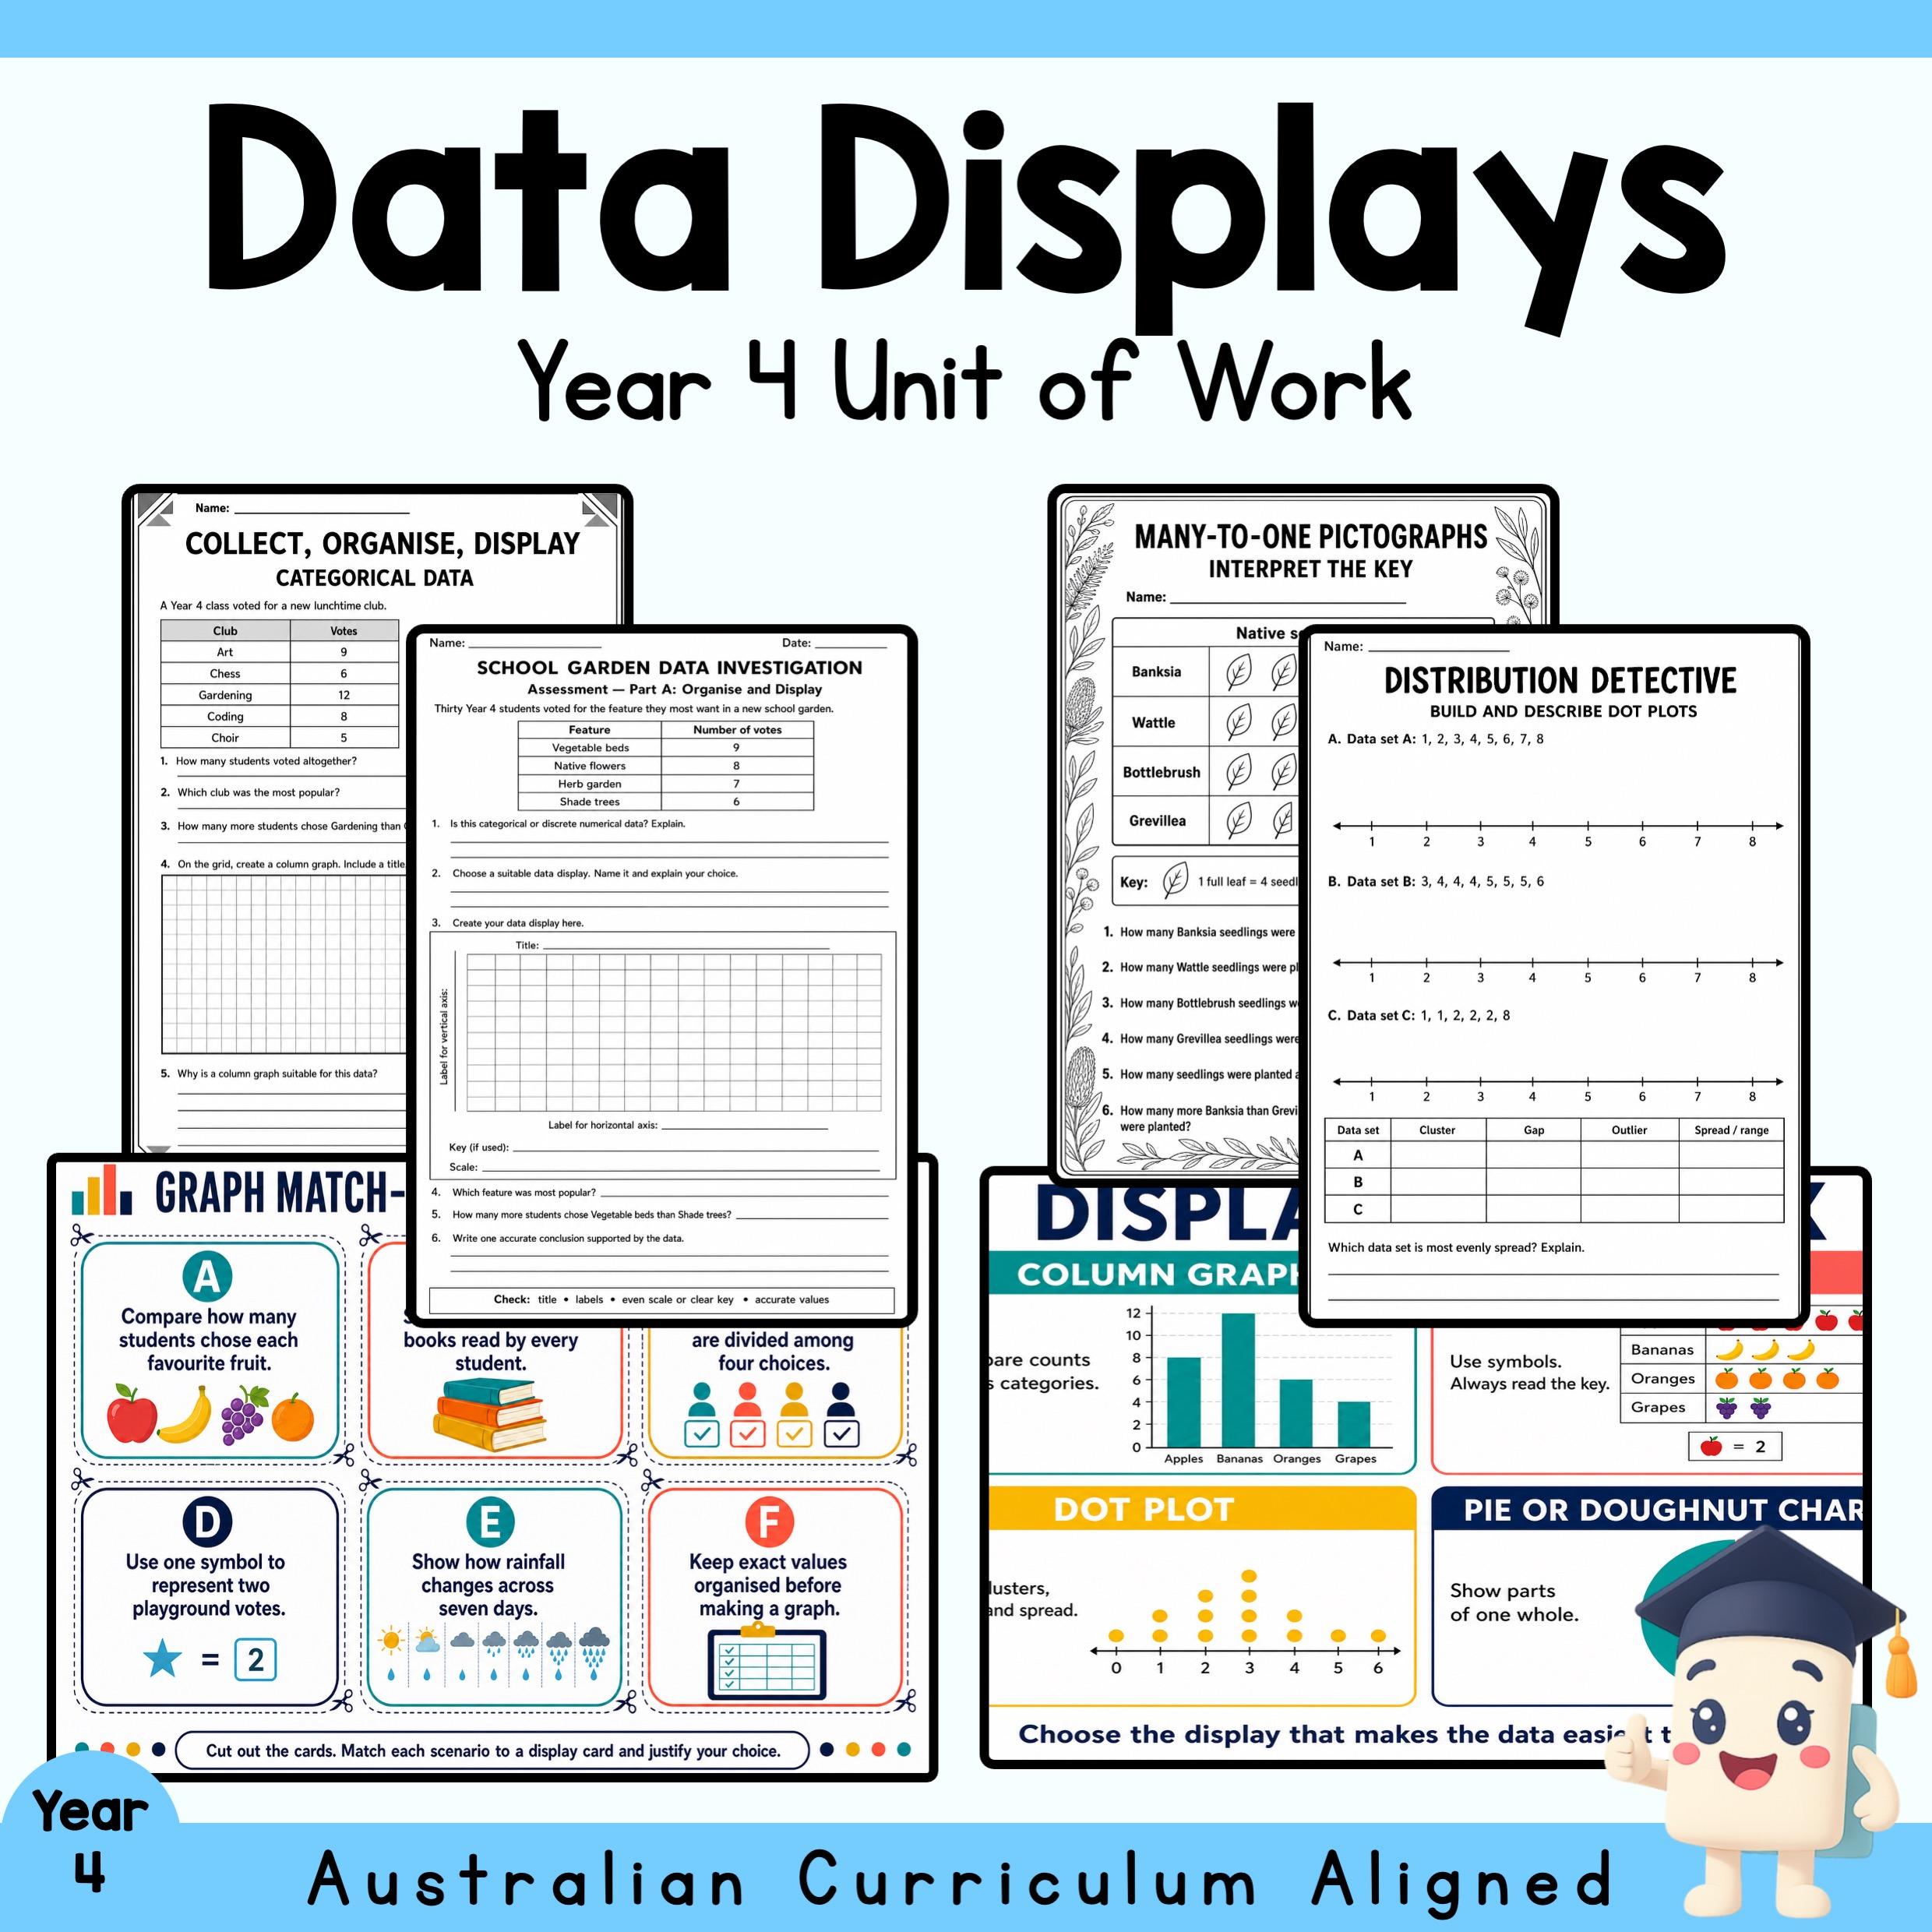
Data Displays – Year 4 gives teachers a coherent sequence for moving students from data questions and collection methods to accurate representations, distribution analysis and evidence-based comparison.
Students work with many-to-one pictographs, column graphs, dot plots, pie charts and doughnut charts. They learn to use titles, labels, even scales and keys; calculate and interpret frequencies; identify clusters, gaps, outliers and range; compare variation; and explain why one display may communicate a data set more effectively than another.
The unit combines explicit teaching with colour reference displays, collaborative games and gallery tasks, twelve economical black-and-white practice pages, matched red-answer pages and a two-part garden-data assessment. The editable presentation and quiz support whole-class instruction, while the five-band rubric makes assessment expectations clear.
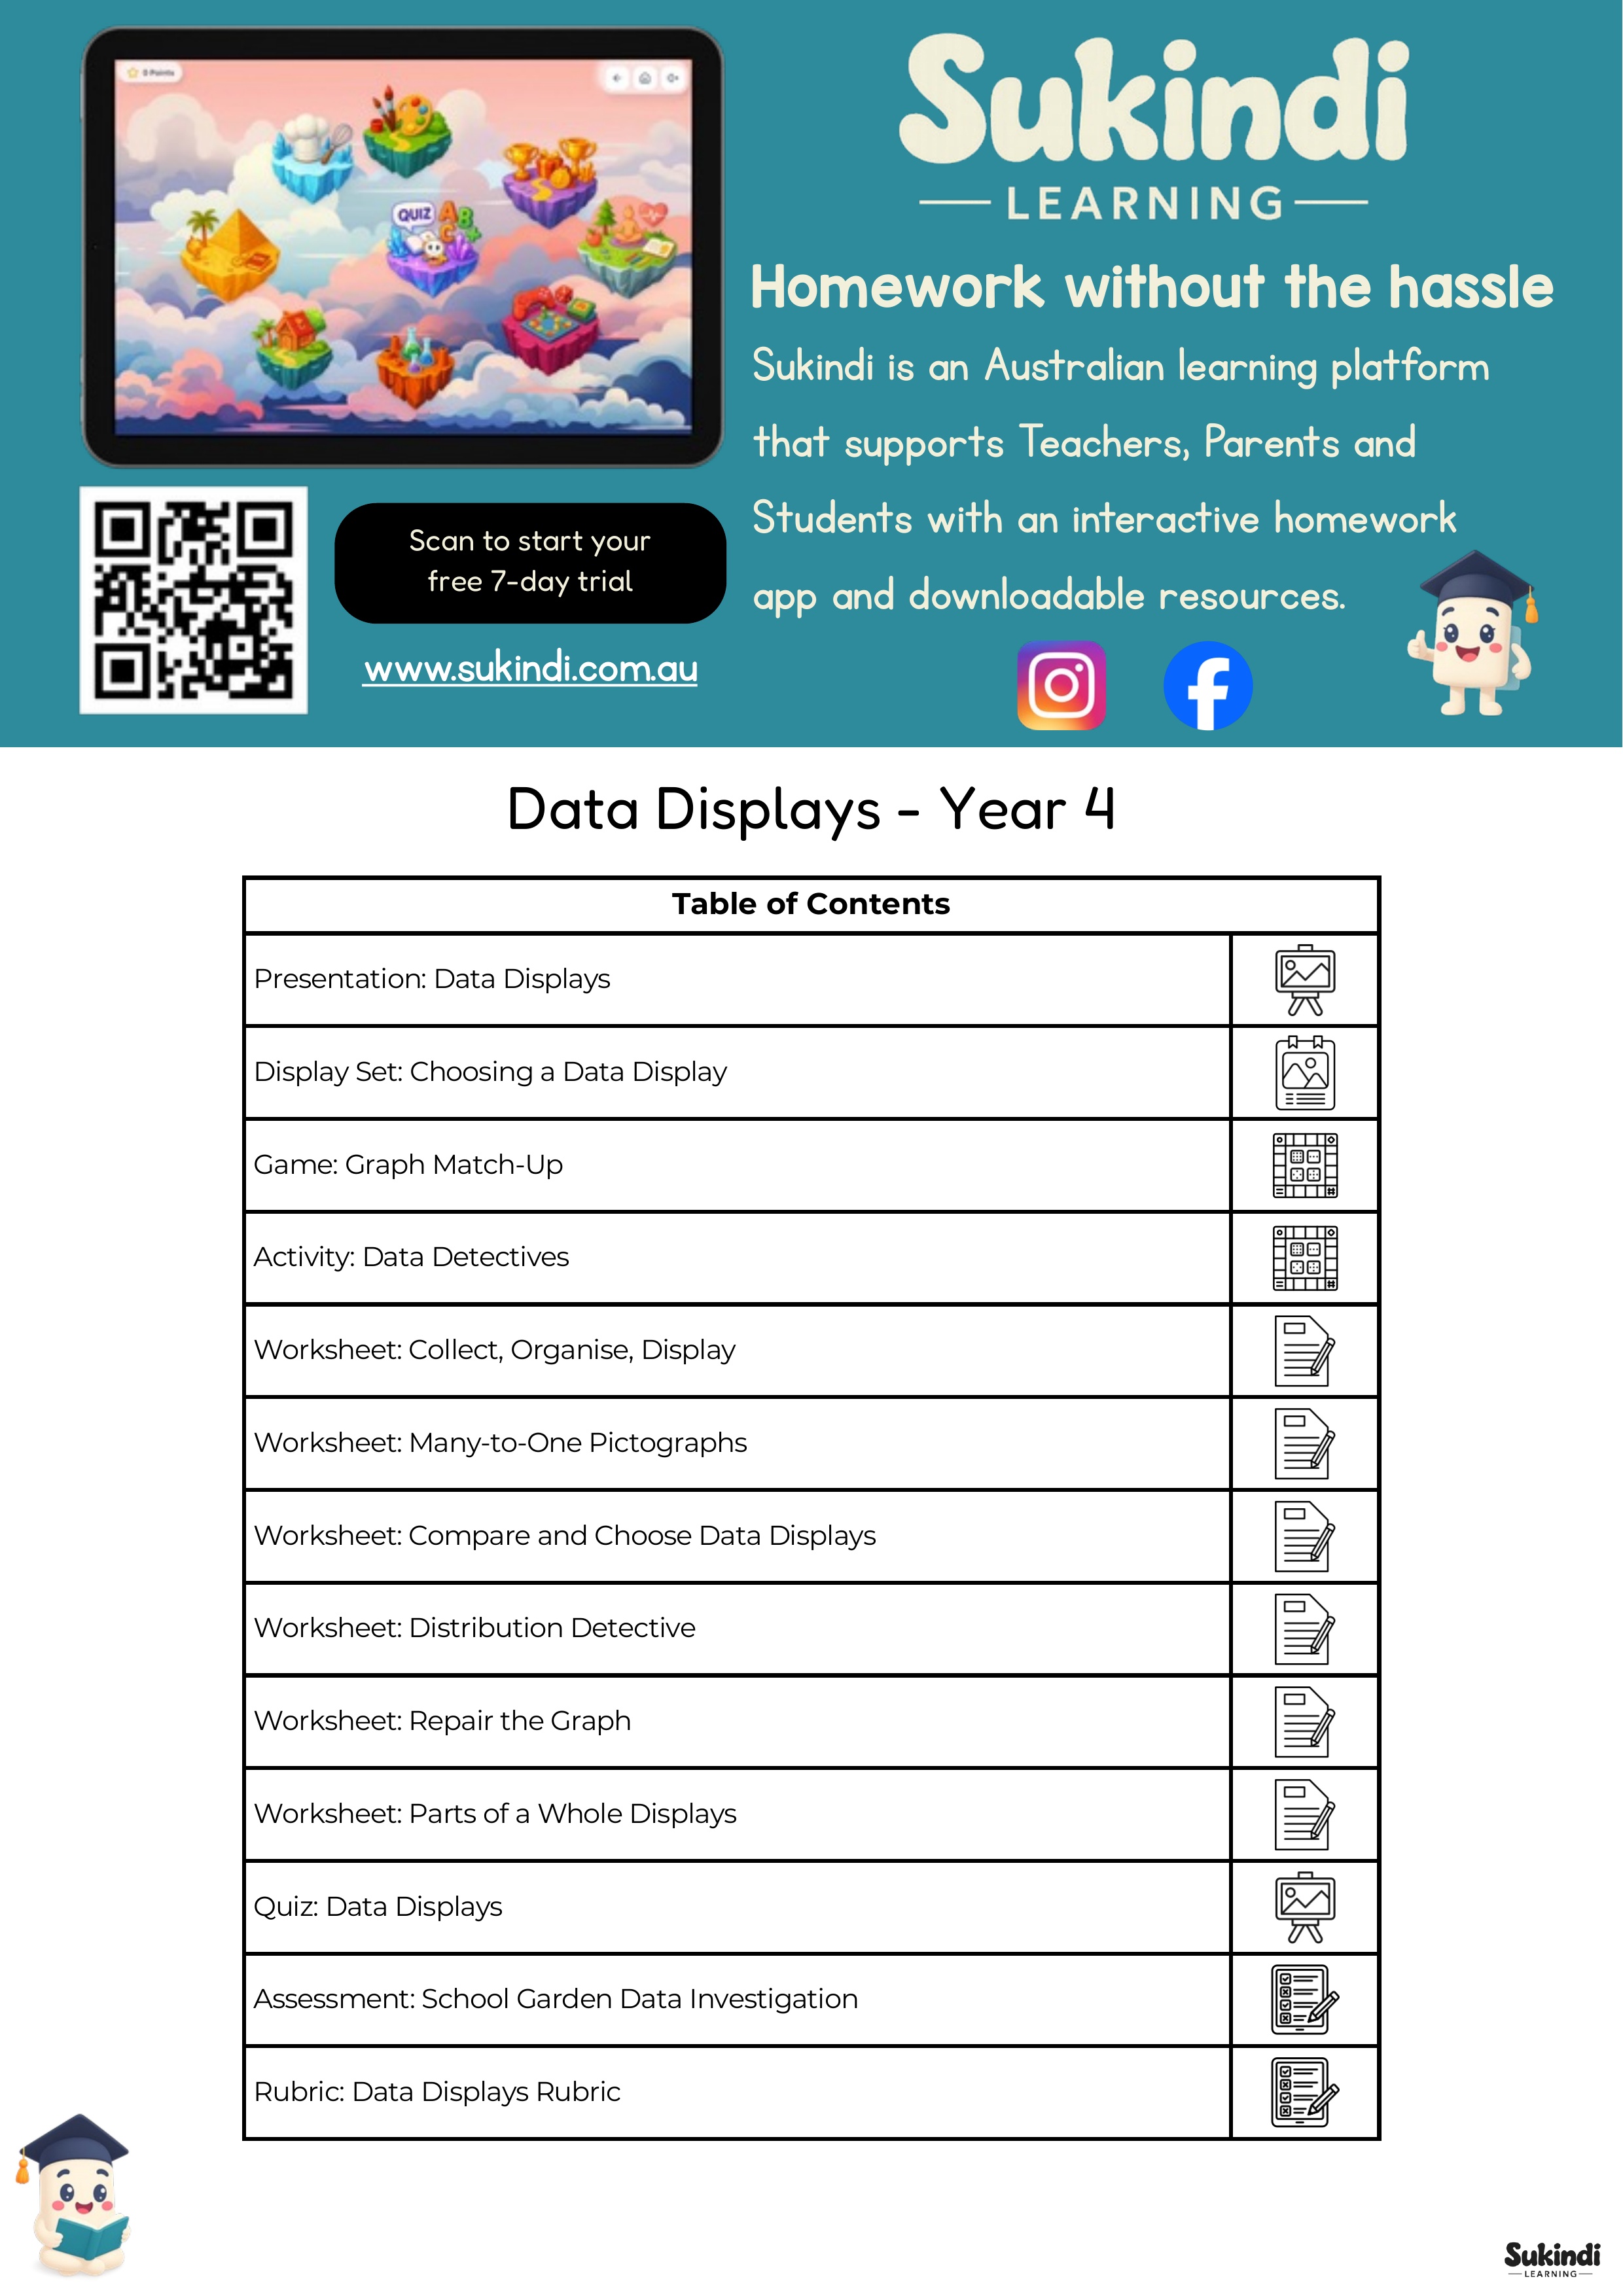
WHAT'S INCLUDED
Editable 18-slide PowerPoint presentation: Data Displays
Editable 22-slide quiz with 10 question-and-answer pairs
36-page unit plan PDF
Display Set: Data Display Toolbox; Clear, Accurate, Useful
Game: Graph Match-Up data cards and display cards
Activity: Data Detectives, cases 1–8
Collect, Organise, Display: Categorical Data
Collect, Organise, Display: Discrete Numerical Data
Many-to-One Pictographs: Interpret the Key
Many-to-One Pictographs: Create the Display
Compare Data Displays: Same Data, Different View
Choose the Best Data Display
Distribution Detective: Build and Describe Dot Plots
Compare Distributions: Similar Centre, Different Variation
Repair the Graph: Find, Explain, Improve
Create a Column Graph: Library Visits
Parts of a Whole: Read a Pie Chart
Parts of a Whole: Plan a Garden Budget
School Garden Data Investigation: Part A and Part B
Assessment answer pages
Data Displays Assessment Rubric with five achievement bands
14 matched answer pages in total
76-page combined preview PDF
LEARNING FOCUS
Acquire categorical and discrete numerical data for questions of interest.
Organise data in tables and frequency structures.
Construct many-to-one pictographs, column graphs, dot plots and parts-of-a-whole displays.
Interpret displays and compare category counts.
Describe distribution shape, clusters, gaps, outliers, range and variation.
Evaluate display effectiveness and justify choices with evidence.
CLASSROOM USE
Use the presentation to introduce one focus at a time, then select the paired display, game, activity or worksheet for guided and independent practice. The six two-page worksheet sets support a full week or a longer differentiated sequence. Use the two-part assessment and five-band rubric at the end of the unit, or separate the parts across two lessons.
YEAR / SUBJECT / TOPIC
Year level: Year 4
Subject: Mathematics
Strand: Statistics
Topic: Data displays, graphing, distributions and variation
CURRICULUM ALIGNMENT
Australian Curriculum v9
AC9M4ST01
AC9M4ST02
Australian Curriculum v8
ACMSP096
ACMSP097
Victorian Curriculum
VC2M4ST01
VC2M4ST02
NSW Mathematics K–10
MA2-DATA-01
MA2-DATA-02
Western Australian Curriculum
ACMSP096
ACMSP097
Common Core State Standards
4.MD.A.2
4.MD.B.4
Texas Essential Knowledge and Skills
G4-1C
G4-1F
G4-9A
G4-9B
Ontario Mathematics
D1.1–D1.6
UK National Curriculum
UKS2-Y5-MATH-S
New Zealand Curriculum
Y4/Y5 STAT-AN-1
FORMATS AND ANSWERS
Formats: PDF and editable PPTX
Unit plan: 36 pages
Presentation: 18 slides
Quiz: 22 slides
Preview: 76 pages
Answer-key status: Included — 14 matched answer pages
TEACHER BENEFITS
One coherent teaching sequence with explicit instruction, practice and assessment.
Black-and-white student pages support economical printing.
Colour displays and games are ready for classroom use.
Matched answers reduce marking time and make self-checking possible.
Multiple data-display types support comparison and deeper reasoning.
Editable PowerPoint decks can be adapted to class pacing.
DIGITAL PRODUCT AND LICENCE
This is a digital teaching product; no physical item is supplied. Purchase permits use by the purchasing teacher with their own classes. Files may not be resold, redistributed, shared publicly or uploaded to shared resource libraries.