Data – Year 4
Click here to preview this resource
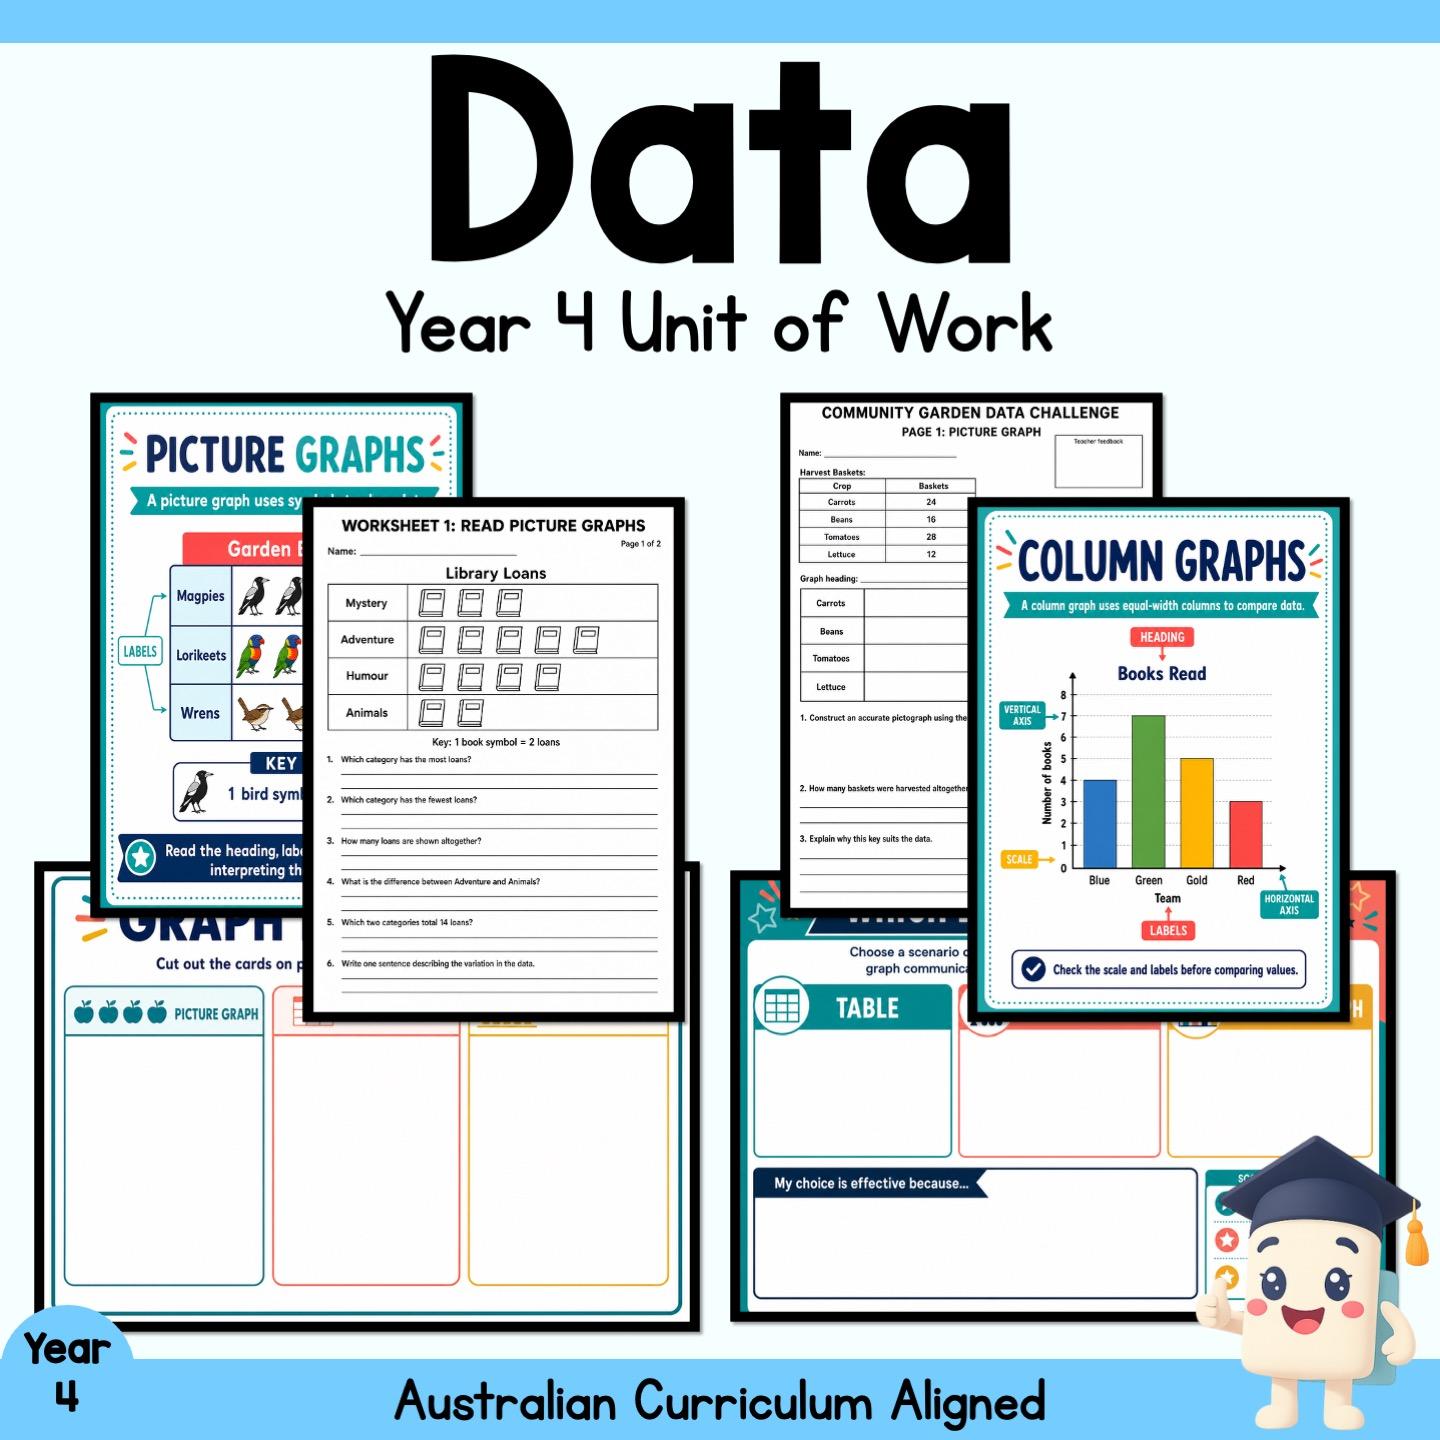
Data – Year 4 gives teachers a coherent week of explicit teaching, guided practice, hands-on comparison tasks, independent worksheets and assessment. Students begin by asking useful statistical questions and organising categorical or discrete numerical responses. They then read and build many-to-one picture graphs, construct vertical and horizontal column graphs, choose efficient scales, compare alternative displays and describe highest and lowest values, spread and variation using evidence.
The editable 24-slide presentation models each concept in sequence. The editable 22-slide quiz provides 10 questions with matching answer slides. A 39-page A4 unit plan supplies colour displays and activities, black-and-white worksheet and assessment pages, 13 matching red answer pages, a four-page class investigation, a three-page assessment and a marking rubric.
WHAT'S INCLUDED
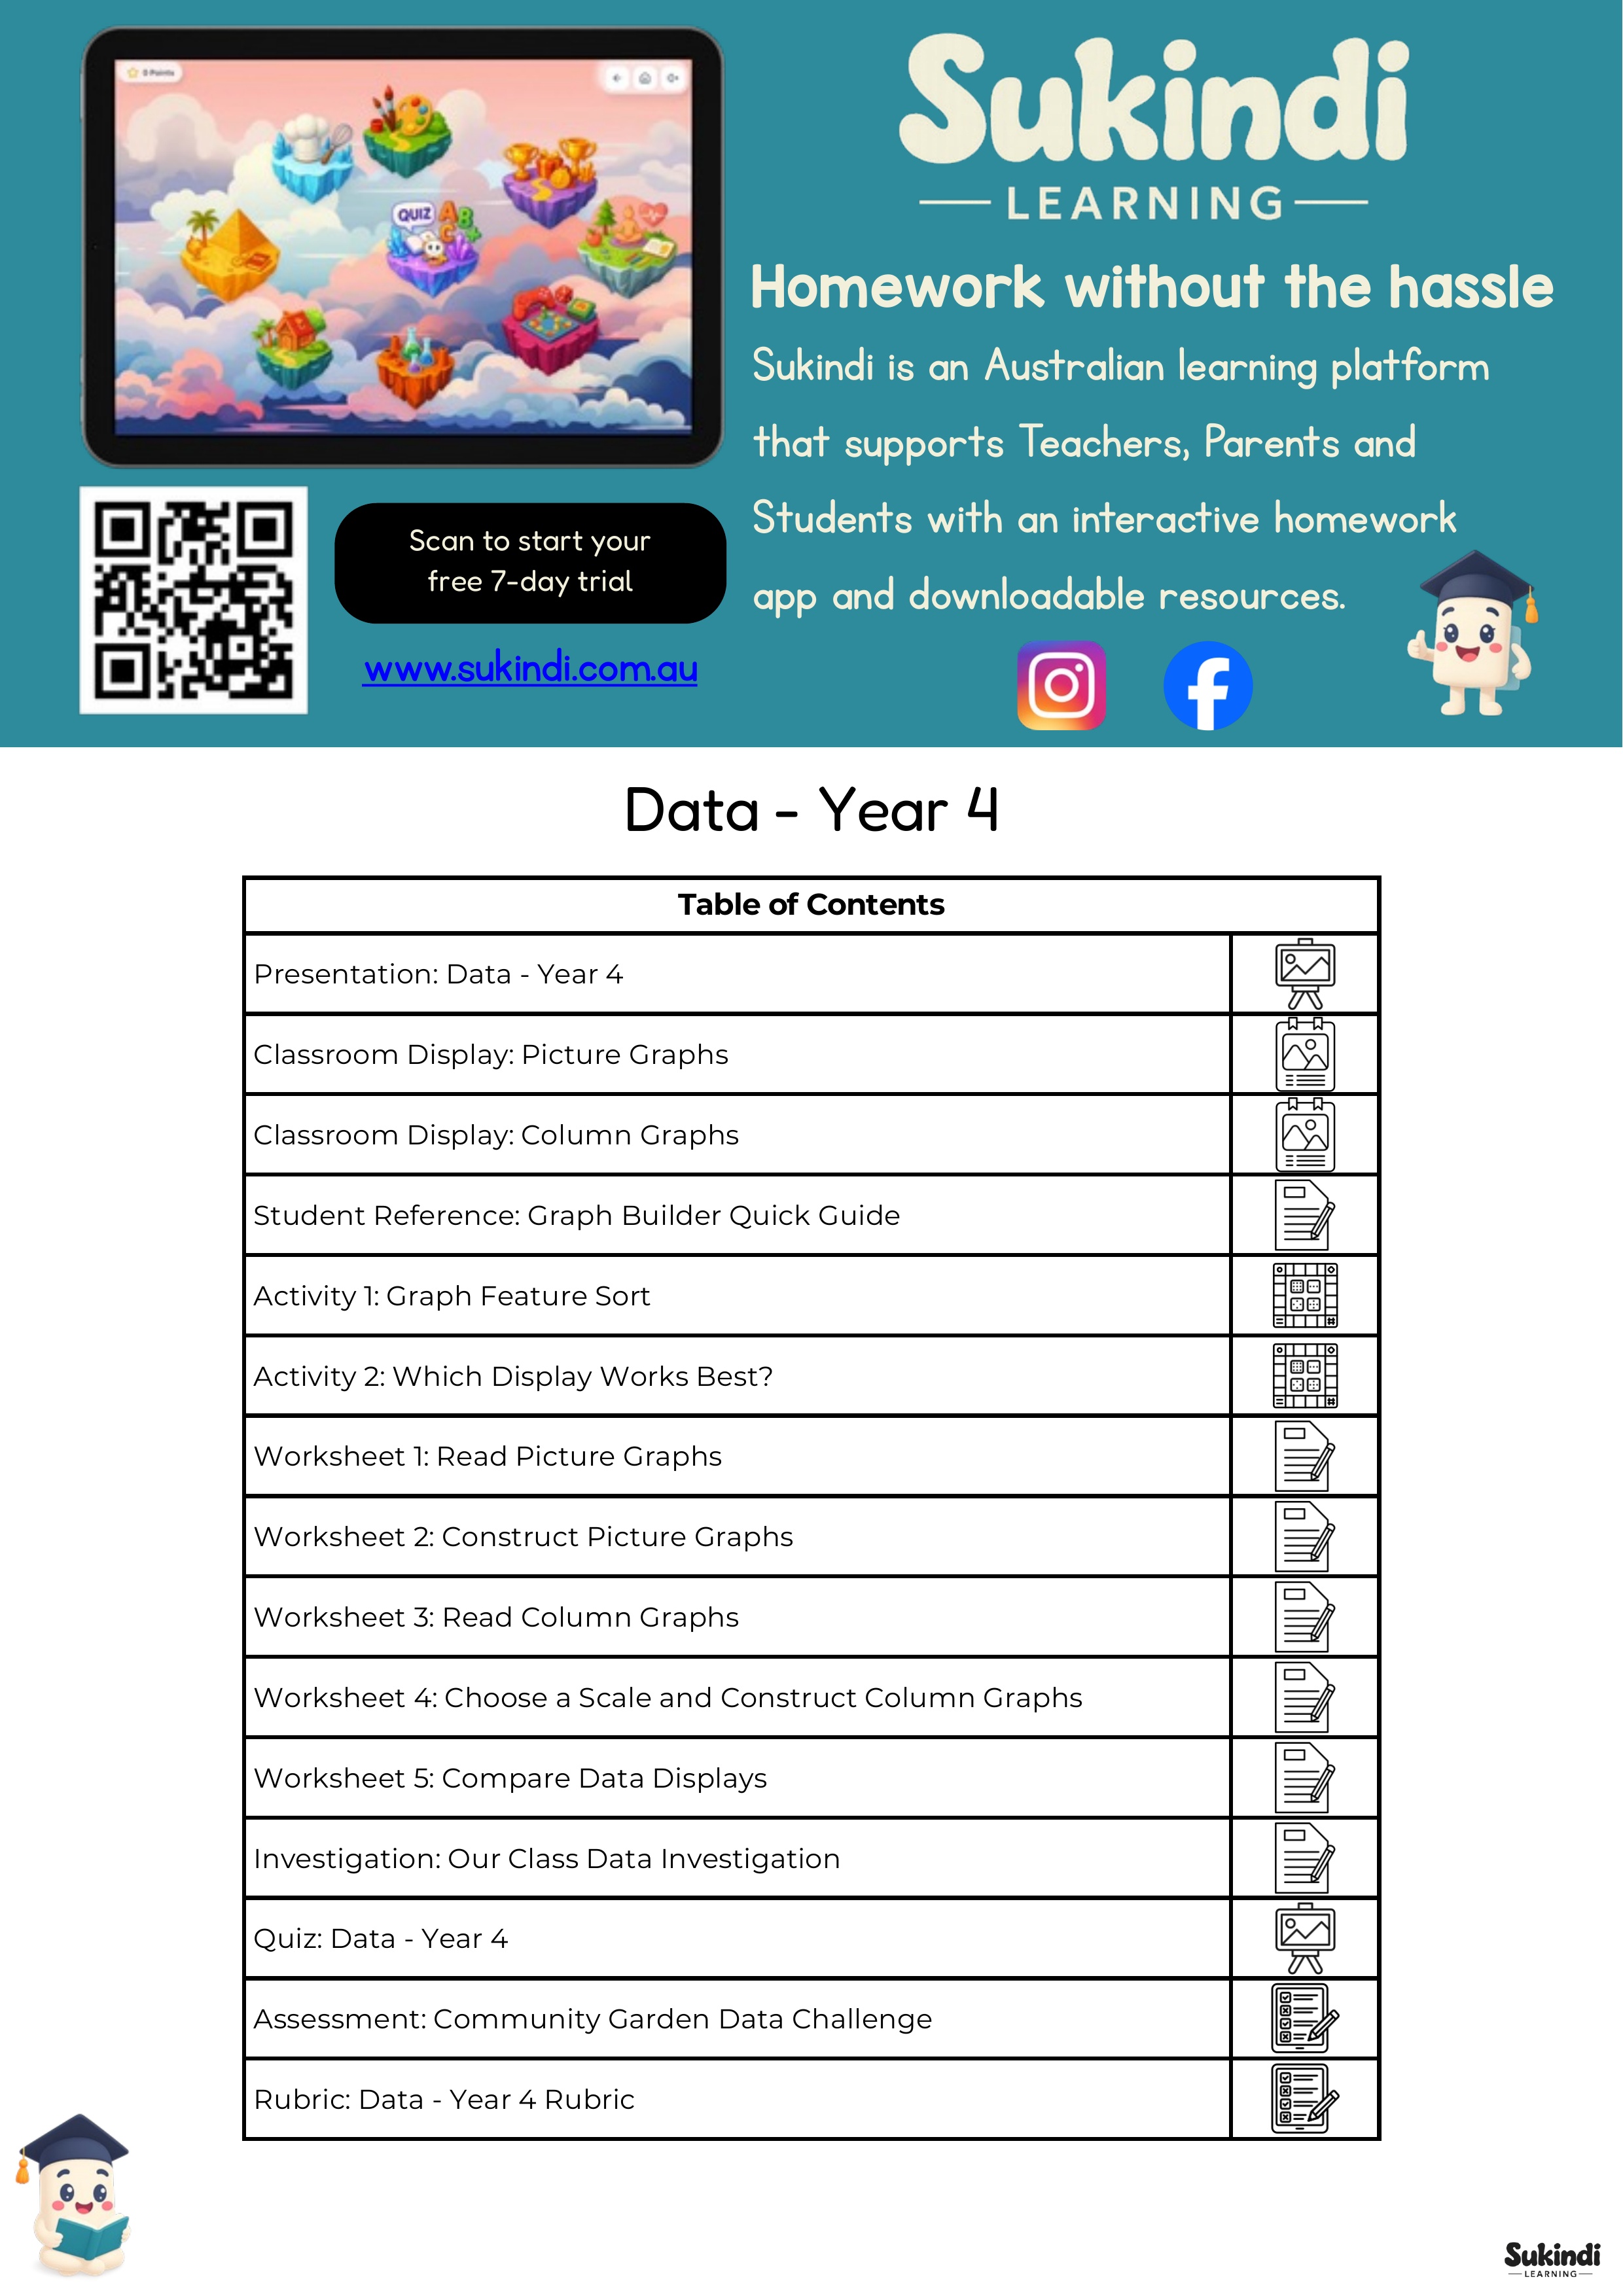
• Data - Year 4 editable PowerPoint presentation (24 slides)
• Data - Year 4 editable PowerPoint quiz (22 slides)
• Data - Year 4 unit-plan PDF (39 A4 pages)
• Classroom Display: Picture Graphs
• Classroom Display: Column Graphs
• Student Reference: Graph Builder Quick Guide
• Activity 1: Graph Feature Sort — mat and 16 cards (2 pages)
• Activity 2: Which Display Works Best? — mat and 8 scenarios (2 pages)
• Worksheet 1: Read Picture Graphs — Library Loans and Garden Visitors (2 student pages plus 2 answers)
• Worksheet 2: Construct Picture Graphs — Recycling Drive and Lunchbox Fruit (2 student pages plus 2 answers)
• Worksheet 3: Read Column Graphs — Rainy Days by Month and Books Read by Teams (2 student pages plus 2 answers)
• Worksheet 4: Choose a Scale and Construct Column Graphs — Active Minutes and School Fair Tickets (2 student pages plus 2 answers)
• Worksheet 5: Compare Data Displays — After-school Clubs and Scale Changes the Story (2 student pages plus 2 answers)
• Investigation: Our Class Data Investigation (4 pages)
• Assessment: Community Garden Data Challenge (3 student pages plus 3 answers)
• Rubric: Data - Year 4 Rubric (1 page)
• Combined protected preview PDF (85 pages)
• Clean Table of Contents JPEG
LEARNING FOCUS
• Form purposeful questions and collect fair data.
• Organise responses with tallies and frequency tables.
• Interpret and construct picture graphs using many-to-one keys.
• Interpret and construct vertical and horizontal column graphs.
• Select an efficient scale and an appropriate display for the question and data.
• Compare displays and communicate conclusions about highest and lowest values or categories, spread and variation.
CLASSROOM USE
Use the presentation for whole-class modelling, the displays and quick guide for visual reference, and the two activities for collaborative reasoning. The five worksheet sets provide progressive practice across the week. Finish with the class investigation or Community Garden Data Challenge and use the rubric to record achievement and next steps.
YEAR / SUBJECT / TOPIC
Year level: Year 4
Subject: Mathematics
Topic: Data representation and interpretation; picture graphs; column graphs; statistical investigations
CURRICULUM ALIGNMENT
Australian Curriculum v9.0
AC9M4ST01; AC9M4ST02
Australian Curriculum v8.4
ACMSP096; ACMSP097
Victorian Curriculum 2.0
VC2M4ST01; VC2M4ST02
New South Wales Curriculum
MA2-DATA-01; MA2-DATA-02
Western Australian Curriculum
ACMSP096; ACMSP097
Common Core State Standards
CCSS.MATH.CONTENT.4.MD.A.2; CCSS.MATH.CONTENT.4.MD.B.4
United Kingdom Curriculum
UK-UKS2-Y5-MATH-S
New Zealand Curriculum
NZ-Y4-MATH-STAT-AN-1; NZ-Y5-MATH-STAT-AN-1
Texas Essential Knowledge and Skills
TEKS-MATH-G4-1C; TEKS-MATH-G4-1F; TEKS-MATH-G4-9A; TEKS-MATH-G4-9B
Ontario / Canada Mapping
CAN-G4-MATH-D1.1; CAN-G4-MATH-D1.2; CAN-G4-MATH-D1.3; CAN-G4-MATH-D1.4; CAN-G4-MATH-D1.5; CAN-G4-MATH-D1.6
FORMATS, PAGE COUNT AND ANSWERS
Formats: Editable PPTX, print-ready PDF and JPG
Unit plan: 39 A4 pages
Presentation: 24 slides
Quiz: 22 slides
Combined content: 85 pages/slides
Answer key: Included — 13 answer pages with red ANSWERS labels and red answers in the response spaces
TEACHER BENEFITS
• A sequenced teaching path from data collection to evidence-based evaluation.
• Native editable presentation and quiz text for classroom adaptation.
• Print-friendly worksheets and assessment pages with directly matched answers.
• Multiple contexts and display types for varied practice and comparison.
• Investigation, assessment and rubric evidence in one coordinated unit.
DIGITAL PRODUCT AND LICENCE
This is a digital product; no physical item is supplied. Purchase grants use by the purchasing teacher and their own class. The files may not be resold, redistributed, uploaded for public access or shared outside the permitted classroom use.