Year 3 Data and Graphing Unit
Click here to preview this resource
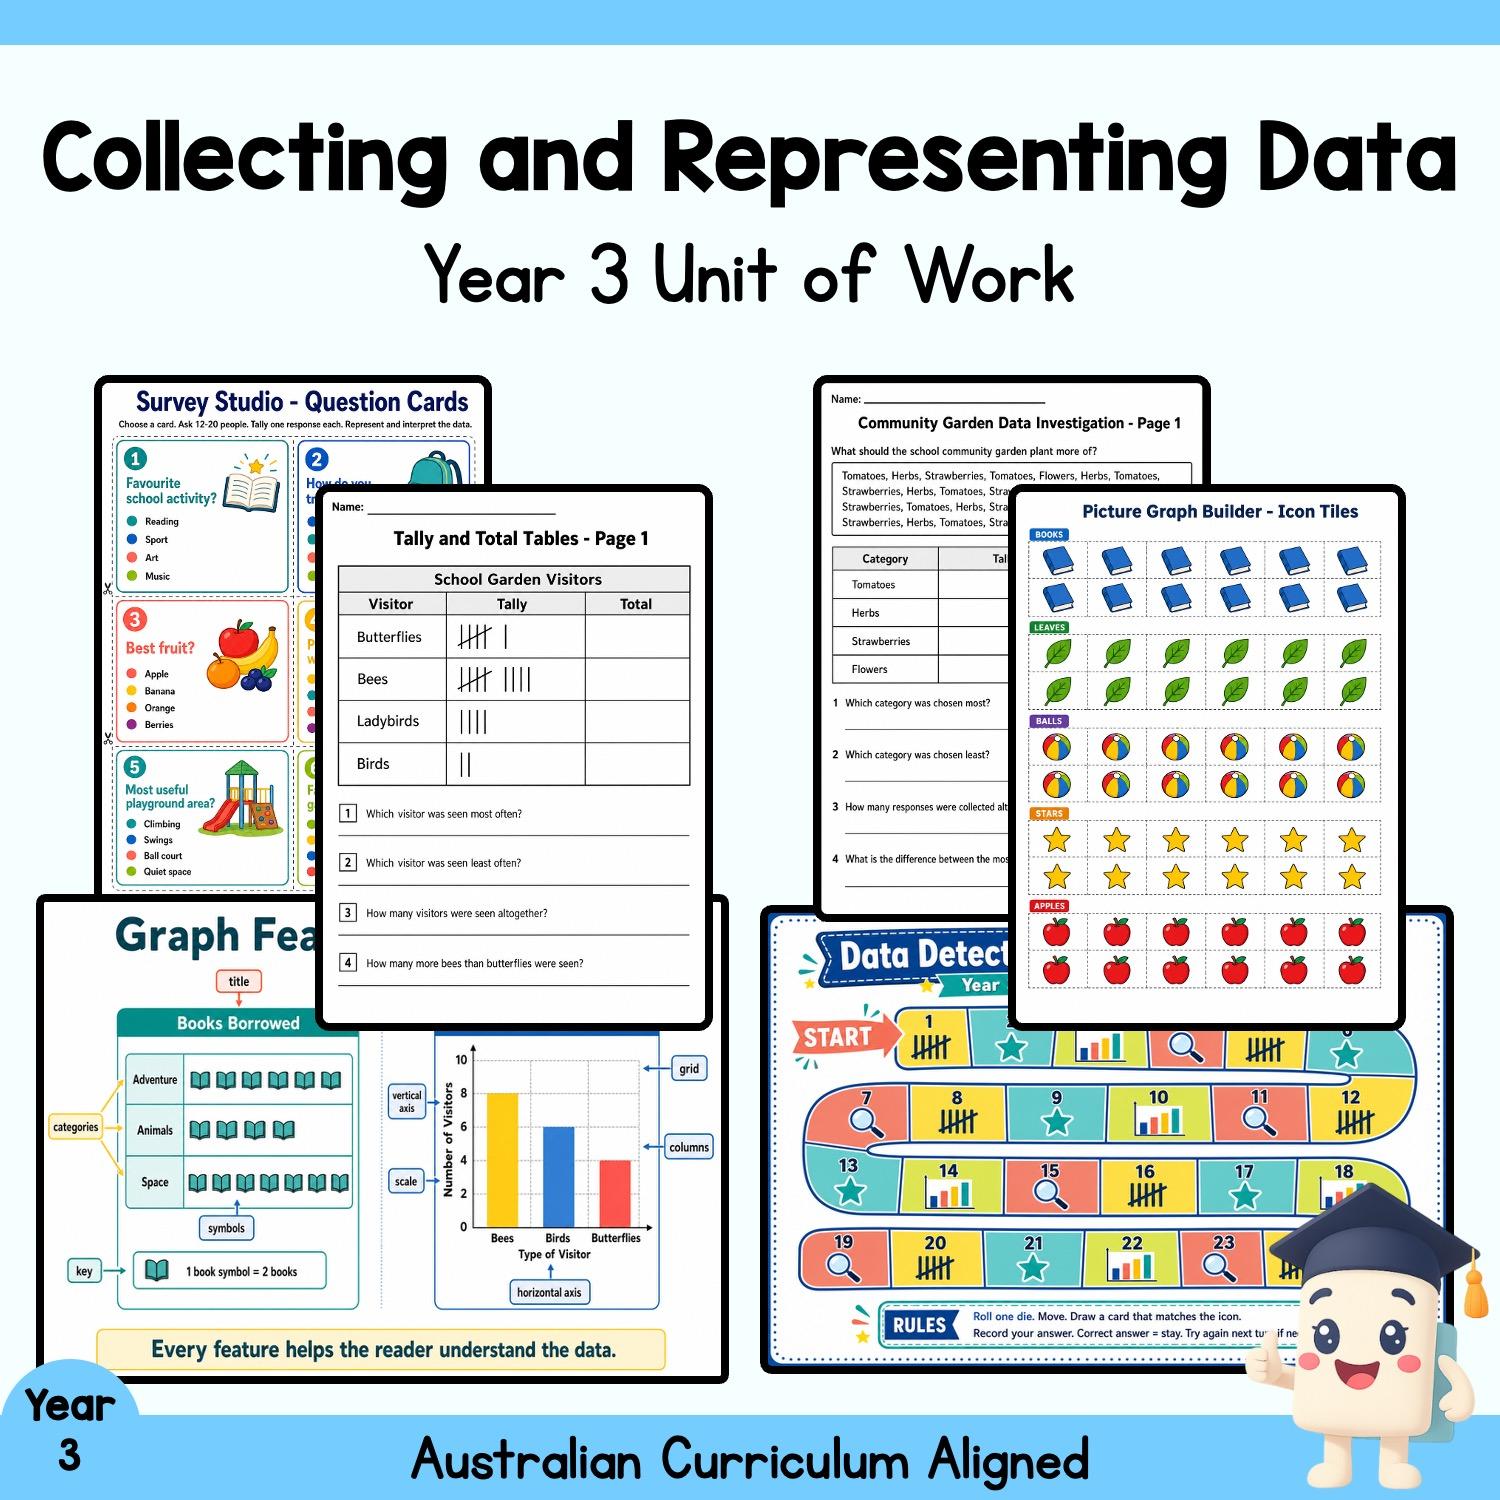
Collecting and Representing Data is a classroom-ready Year 3 Mathematics unit built around a clear data investigation sequence. Students ask questions, collect and tally responses, organise data in tables, construct and interpret picture graphs and column graphs, compare the usefulness of different representations and complete a structured spreadsheet graphing challenge.
The unit supports a full week of teaching with a native editable 20-slide PowerPoint presentation, a native editable 22-slide quiz, two colour classroom displays, four substantial multi-page activities and games, 15 black-and-white worksheet pages, 17 matching answer pages, a two-page assessment and a five-level rubric. Support, core and extension tasks are included, with large response spaces and practical contexts suited to Year 3 learners.
The editable unit plan and print-ready PDF contain 55 pages. Answer pages sit immediately after their matching student pages. Displays, games and hands-on materials are in colour; worksheets, assessment and rubric are black and white for economical printing; answers use clear red text.
WHAT'S INCLUDED
Editable teaching files
Data Yr 3 - Presentation.pptx (20 colour slides, native editable text).
Data Yr 3 - Quiz.pptx (22 colour slides, including 10 question/answer pairs).
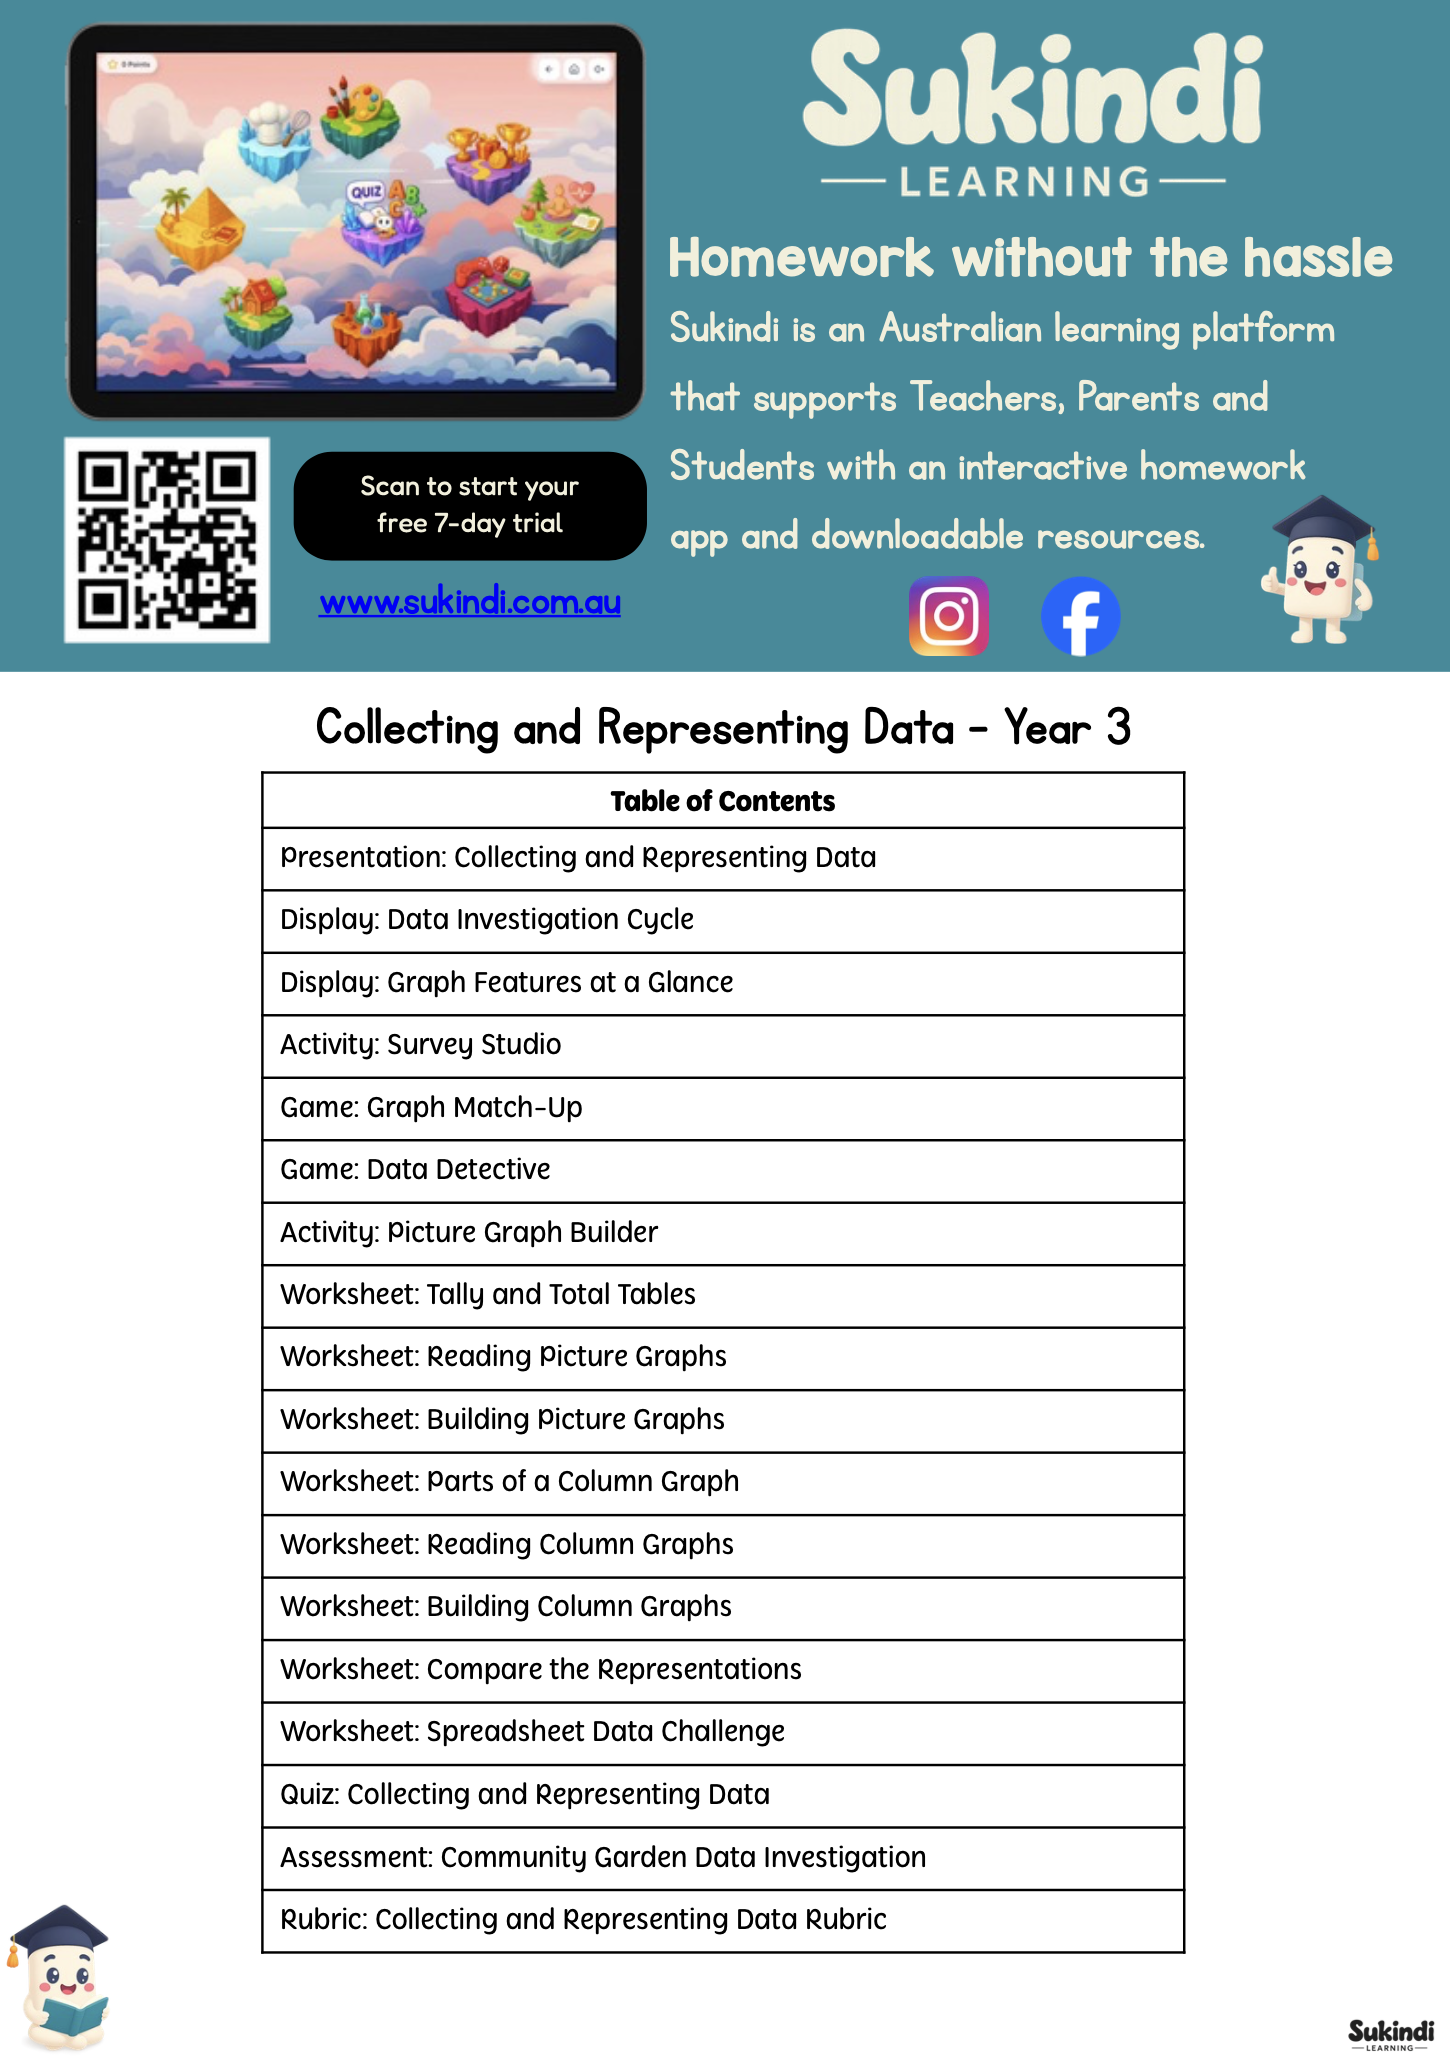
Data Yr 3 - Unit Plan.pptx (55 pages).
Data Yr 3 - TPT Thumbnail.pptx (one finished editable template slide).
PDF teaching and preview files
Data Yr 3 - Unit Plan.pdf (55 pages).
Data Yr 3 - Presentation.pdf (20 slides).
Data Yr 3 - Quiz.pdf (22 slides).
Data Yr 3 - Preview.pdf (97 combined protected pages).
Displays
Data Investigation Cycle.
Graph Features at a Glance.
Activities and games
Survey Studio: question cards, tally sheet, group-comparison sheet and representation planner (4 pages).
Graph Match-Up: rules/sorting mat, two card sheets and self-check key (4 pages).
Data Detective Board Game: board, two question-card sheets, answer key and recording sheet (5 pages).
Picture Graph Builder: construction mat, icon tiles, challenge cards and partner-check sheet (4 pages).
Worksheets
Tally and Total Tables (2 pages).
Reading Picture Graphs (2 pages).
Building Picture Graphs (2 pages).
Parts of a Column Graph (1 page).
Reading Column Graphs (2 pages).
Building Column Graphs (2 pages).
Compare the Representations (2 pages).
Spreadsheet Data Challenge (2 pages).
Assessment, answers and rubric
Community Garden Data Investigation (2 assessment pages).
17 matching answer pages: 15 worksheet answers and 2 assessment answers.
Collecting and Representing Data Rubric (1 A4 landscape page with five achievement levels).
LEARNING FOCUS
Plan and conduct simple data investigations.
Collect and record categorical data accurately.
Use tally marks and totals in tables.
Read and construct picture graphs using a key.
Identify and use titles, axes, labels, scales, columns and gridlines.
Read and construct column graphs.
Compare representations and justify conclusions with evidence.
Enter a data table and create a column graph using a spreadsheet.
CLASSROOM USE
Use the presentation for explicit teaching, the colour activities for guided groups or maths rotations, the worksheets for sequenced independent practice, and the assessment and rubric for end-of-unit evidence. Games and construction materials can be revisited for consolidation after the core week.
YEAR / SUBJECT / TOPIC
Year level: Year 3 / Grade 3
Subject: Mathematics
Topic: Statistics, data collection and graphing
CURRICULUM ALIGNMENT
Australian Curriculum Version 9.0: AC9M3ST02
Australian Curriculum Version 8.4: ACMSP069
Victorian Curriculum Version 2.0: VC2M3ST02
NSW Mathematics K-10: MA2-DATA-01, MA2-DATA-02
Western Australian Curriculum: ACMSP069
Common Core: CCSS.MATH.CONTENT.3.MD.B.3, CCSS.MATH.CONTENT.2.MD.D.10
England: UK-LKS2-Y4-MATH-S
New Zealand: NZ-Y3-MATH-STAT-AN-1, NZ-Y4-MATH-STAT-AN-1, NZ-Y4-MATH-STAT-CON-1
Texas TEKS: TEKS-MATH-G3-8B, TEKS-MATH-G3-1D, TEKS-MATH-G3-1E, TEKS-MATH-G3-8A
Ontario: CAN-G3-MATH-D1.1, CAN-G3-MATH-D1.2, CAN-G3-MATH-D1.3, CAN-G3-MATH-D1.4, CAN-G3-MATH-D1.5
FORMATS, PAGE COUNT AND ANSWERS
Formats: PPTX, PDF, JPG and PNG.
Unit plan: 55 pages, including 54 printable resource, answer, assessment and rubric pages after the Table of Contents.
Presentation: 20 slides.
Quiz: 22 slides.
Combined preview: 97 pages.
Answer status: 17 matching answer pages included for every meaningful worksheet and assessment page.
Suggested teaching duration: Five core lessons across one week, with reusable consolidation resources.
TEACHER BENEFITS
One coherent sequence from data question to interpretation.
Native editable lesson and quiz text for classroom adaptation.
Four reusable activities that support partner work, guided groups and rotations.
Differentiated practice from supported reading to construction and comparison.
Matching answer pages placed beside the relevant student tasks.
Assessment and rubric aligned to the taught skills.
DIGITAL PRODUCT AND LICENCE NOTE
This is a digital product; no physical item is shipped. Purchase permits classroom use by the purchasing teacher under Sukindi's licence terms. Files may not be resold, redistributed, shared publicly or uploaded for use by unlicensed users.