Year 6 Data and Statistics Unit
Click here to preview this resource
About this unit
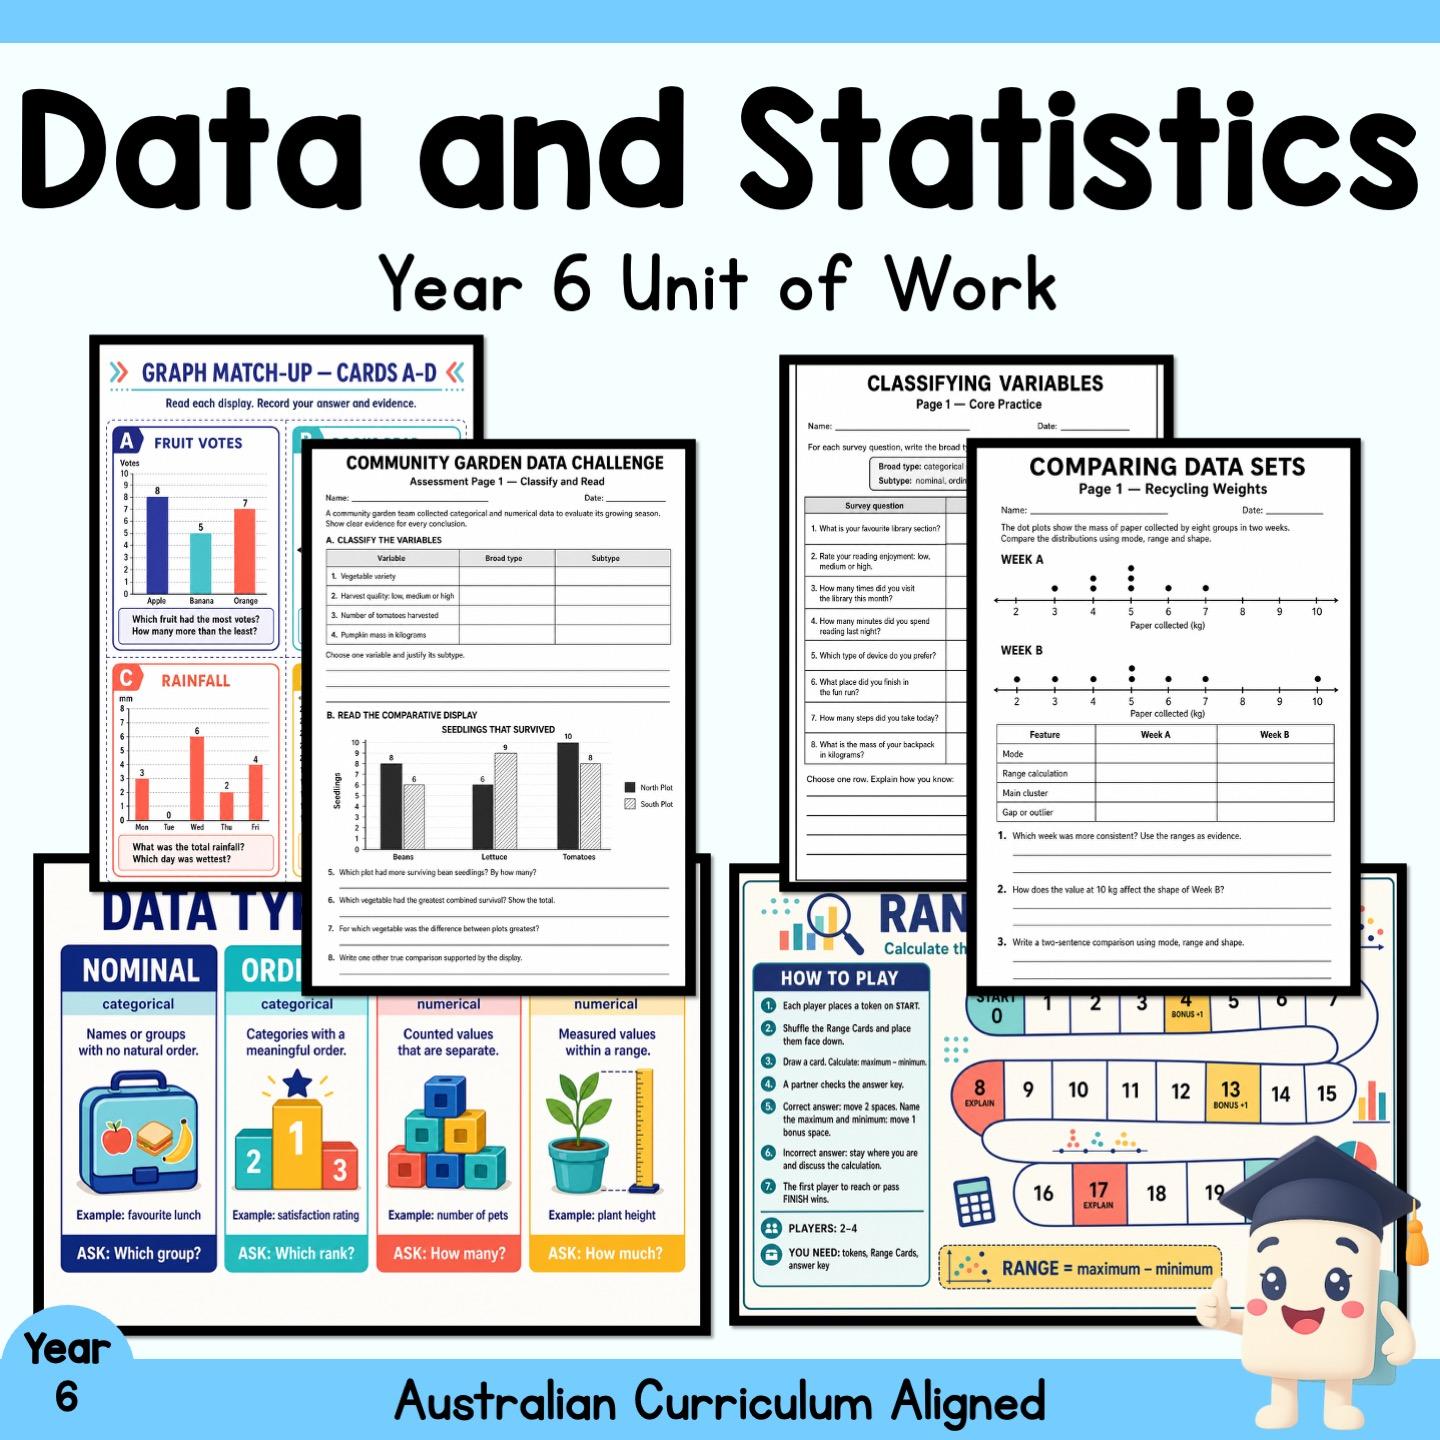
Teach data and statistics through a structured sequence of explicit instruction, guided examples, collaborative tasks, independent practice and assessment. This Year 6 unit introduces nominal and ordinal categorical variables and discrete and continuous numerical variables before students apply those classifications to authentic questions and data sets.
Students read and compare tables, dot plots, column graphs and other comparative displays. They calculate and interpret mode and range, describe clusters, gaps, outliers and distribution shape, check whether claims are supported by evidence and plan a simple statistical investigation. The editable teaching presentation, editable 10-question quiz and 41-page unit plan provide a flexible pathway for whole-class teaching, rotations, homework, intervention, extension and assessment.
What's included
Editable 24-slide PowerPoint presentation: Year 6 Data and Statistics
Editable 22-slide PowerPoint quiz with 10 question/answer pairs
41-page unit plan PDF, comprising one clean Table of Contents page and 40 classroom resource pages
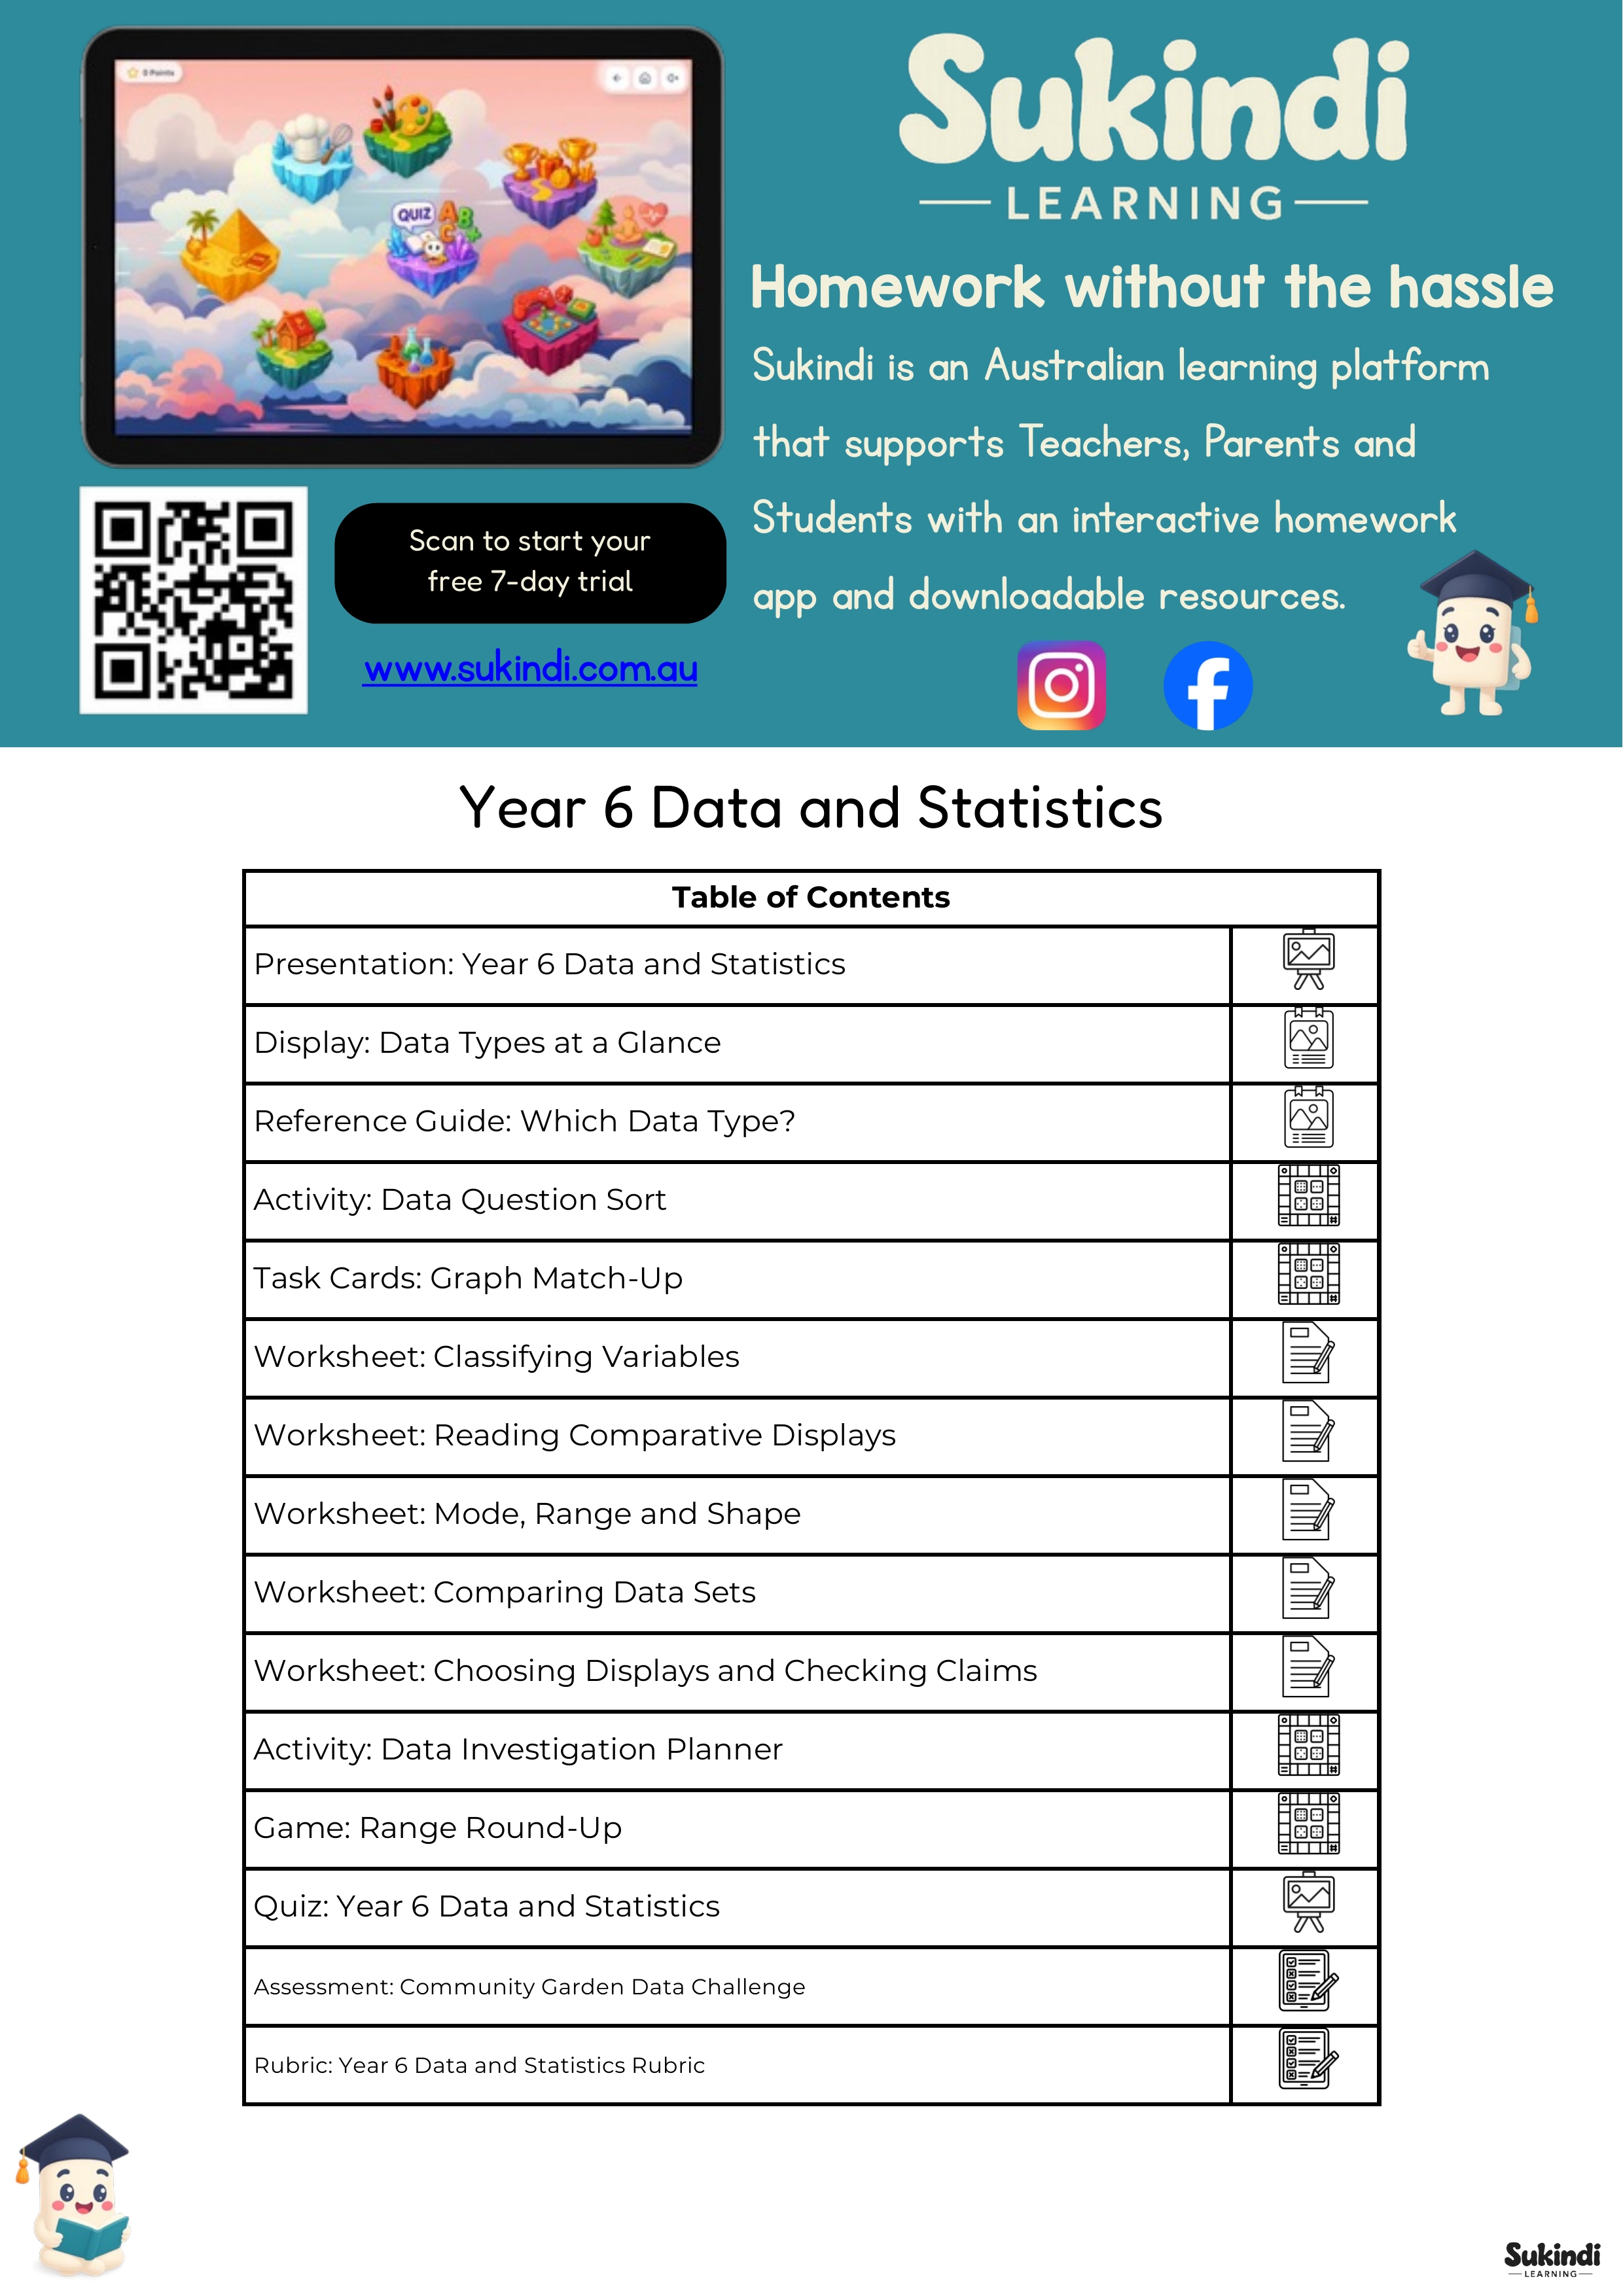
Display: Data Types at a Glance
Reference Guide: Which Data Type?
Activity: Data Question Sort — sorting mat, cards and answer key
Task Cards: Graph Match-Up — two card sheets, recording sheet and answer key
Worksheet: Classifying Variables — two student pages and two answer pages
Worksheet: Reading Comparative Displays — two student pages and two answer pages
Worksheet: Mode, Range and Shape — two student pages and two answer pages
Worksheet: Comparing Data Sets — two student pages and two answer pages
Worksheet: Choosing Displays and Checking Claims — two student pages and two answer pages
Activity: Data Investigation Planner — two planning pages
Game: Range Round-Up — rules/board, two card sheets and answer key
Assessment: Community Garden Data Challenge — two student pages and two answer pages
Rubric: Year 6 Data and Statistics Rubric — five performance levels
Learning focus
Distinguish categorical and numerical variables.
Classify nominal, ordinal, discrete and continuous data.
Select and interpret suitable data displays.
Compare distributions using mode, range and shape.
Identify clusters, gaps and outliers.
Evaluate statistical claims using evidence.
Plan a question, collection method, display and conclusion for an investigation.
Classroom use
Use the presentation for explicit teaching and worked examples, then select from the sorting activity, task cards, five differentiated worksheet sets, investigation planner and range game for guided or independent practice. Finish with the editable quiz, Community Garden Data Challenge and five-level rubric. The complete resource supports approximately 5–10 lessons and can be shortened or extended to suit the class.
Year, subject and topic
Year level: Year 6
Subject: Mathematics
Topic: Data and statistics — variable types, comparative displays, mode, range and distribution shape
Curriculum alignment
Australian Curriculum Version 9: AC9M6ST01
Australian Curriculum Version 8: ACMSP147
Victorian Curriculum 2.0: VC2M6ST01
NSW Mathematics K–10 Syllabus: MA3-DATA-01; MA3-DATA-02
Common Core State Standards: CCSS.MATH.CONTENT.6.SP.A.1; CCSS.MATH.CONTENT.6.SP.A.2; CCSS.MATH.CONTENT.6.SP.B.4; CCSS.MATH.CONTENT.6.SP.B.5
England: UK-UKS2-Y6-MATH-S; UK-KS3-MATH-S
New Zealand: NZ-Y6-MATH-STAT-PLAN-1; NZ-Y6-MATH-STAT-DATA-1; NZ-Y6-MATH-STAT-AN-1; NZ-Y6-MATH-STAT-CON-1; NZ-Y6-MATH-STAT-SL-1
Texas: TEKS-MATH-G6-1D; TEKS-MATH-G6-5A; TEKS-MATH-G6-9A; TEKS-MATH-G6-12A; TEKS-MATH-G6-12B; TEKS-MATH-G6-12C; TEKS-MATH-G6-12D; TEKS-MATH-G6-13A; TEKS-MATH-G6-13B
Canada: CAN-G6-MATH-D1.1; CAN-G6-MATH-D1.2; CAN-G6-MATH-D1.3; CAN-G6-MATH-D1.4; CAN-G6-MATH-D1.5; CAN-G6-MATH-D1.6
Formats, page counts and answers
Unit plan: 41 pages
Presentation: 24 slides
Quiz: 22 slides
Answer key: Included — 15 matching answer/key pages
Printing: Colour display/activity/game pages; black-and-white worksheets, assessment and rubric; red-answer keys
Teacher benefits
A sequenced teaching pathway from classification to comparison and evaluation.
Multiple practice formats for whole-class, small-group and independent learning.
Substantial response space and two-page worksheet sets for age-appropriate depth.
Matching answer pages and a criterion-referenced rubric for efficient feedback.
Editable presentation and quiz text for local classroom adaptation.
Digital product and licence
This is a digital product; no physical item is supplied. Purchase permits use by one teacher/classroom in accordance with Sukindi's licence terms. The files may not be redistributed, resold, shared with unlicensed users or made publicly available.